Module 2 - Remote Sensing Applications using Google Earth Engine#
What will you learn from this module?
Set up Google Earth Engine (GEE)
Familiarize with GEE Interface
Download and visualize RS data using Code Editor in GEE
1. Setting up GEE#
Please request an account with Google Earth Engine (GEE) as follows:
Go to the GEE webpage here
Select “Sign Up” at the top right of the page and input institution and intention for use (e.g. using remote sensing datasets for land use suitability modeling).
📌 Approval may not happen immediately, so please be sure to sign up in advance of the workshop to provide a few days for completion.
2. Exploring GEE Interface#
The video and Figure below show general interface functions for GEE. Further description of the components of the Figure can be found here.
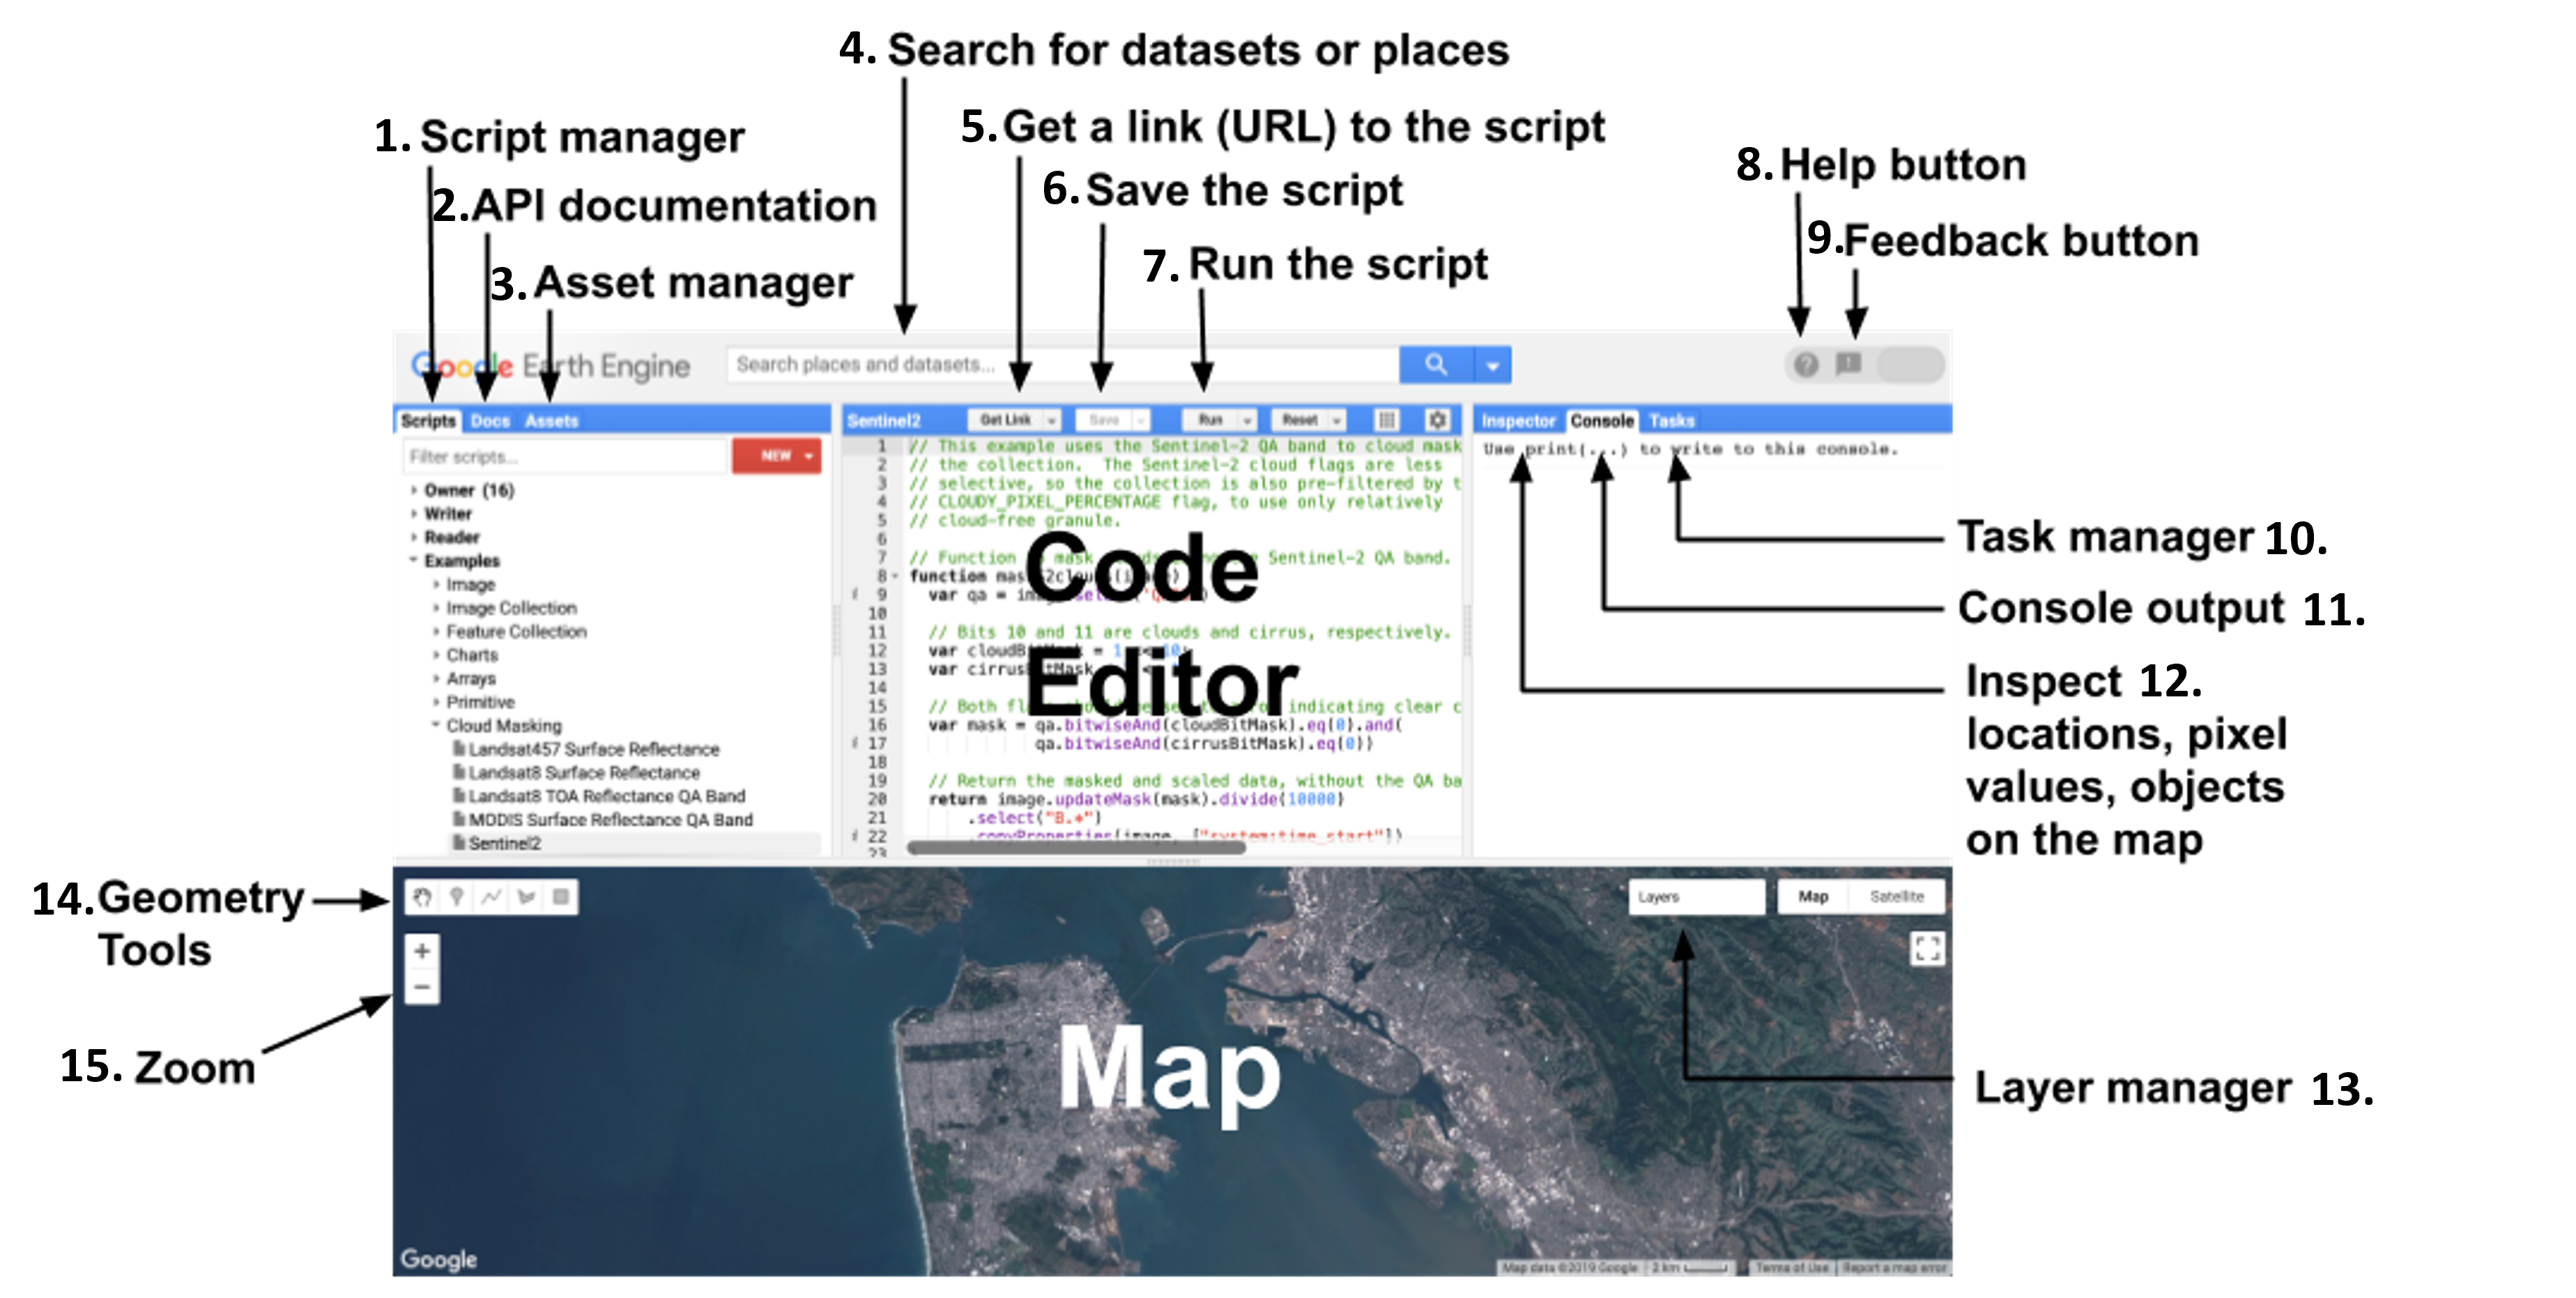
📌In this workshop, we will be programming in the GEE code editor that uses the JavaScript language. There are extra resources available from Google to introduce the JavaScript Application Programming Interface (API).
3. Using GEE to Explore RS Concepts from Module-1#
3.1 Downloading and Visualizing Landsat Data#
In the following example, we will use GEE to download and visualize Landsat satellite data in Ghana. Please use the video tutorial in Section 3.2 to follow along.
- Copy the script "01_search_and_display" and paste into the GEE code editor. This is the same script that will be used in Exercise with slight alterations necessary to complete the Exercise.
- The script includes:
- Defining variables for dates of interest: ST_DATE and EN_DATE
- Defining the region of interest using 4 coordinates: Longitude_min, Latitude_min, Longitude_max, Latitude_max
- Defining variables for RS data products: Here, data products from Landsat 5, 7, and 8 are used.
- Selecting the data product: Landsat 5.
- Filtering the data product by the region and dates of interest, and by the amount of cloud cover.
- Repeating d and e with Landsat 7 & 8.
- Setting the visualization parameters for each product: bands, min, max, gamma.
- Mapping the images: Centering, and adding RS data in three layers.
- Exporting images to Google Drive.
For information on Landsat bands, please refer to Module 1.
The parameters min, max, and gamma describe the RGB visual representation. For more details on these, see here.
3.2 Video Tutorial for the Section 3.1#
Use the video tutorial to follow along with the example. This may also be useful in completing the exercise.