Module 1 - Software and Data Preparation#
What will you learn from this module?
Installing QGIS and PyLUSAT, and loading LUCIS-OPEN Tools for QGIS,
Be familiar with the user interface of QGIS,
Visualizing GIS data and creating maps.
1. Software Installation#
📌 Note on installation:
To set up your computer, please download and install QGIS 3.20. We recommend all participants for the Chobe Open-LUCIS (COL) training to use this version of QGIS for consistency. The latest version of QGIS and other resources can be found here. Please follow the instruction to install the Python for Land-use Suitability Analysis Tools (PyLUSAT), which must be installed before we can successfully start the COL training. The PyLUSAT tools to be loaded and run for this training were developed by GALUP.
2. GIS Datasets#
The table below lists the GIS datasets used for this module.
They can be found within the downloaded zip folder from the previous section at
GALUP-master -> training -> 5_chobe -> datasets.
ID |
File Name |
Data Format |
Type |
Description |
|---|---|---|---|---|
1 |
BWA_Healthsites.shp |
vector |
point |
Health facilities in Botswana |
2 |
BWA_Roads_PrimarySecondary2023.shp |
vector |
line |
Primary and secondary roads in Botswana |
3 |
BWA_ADM_2021.shp |
vector |
polygon |
Districts of Botswana |
4 |
BWA_Population_Density.tif |
raster |
tiff |
Population of Botswana in 2022 |
3. Working with QGIS#
In this section, we will explore the QGIS Graphical User Interface (GUI) and the basic functions including visualizing GIS data and creating maps.
To get an overview and understand each GUI element’s purposes, including (1) Layers List / Browser Panel, (2) Toolbars, (3) Map canvas, (4) Status bar, (5) Side Toolbar, (6) Locator bar, please checkout this page.
Moreover, you can customize the GUI by dragging and moving Panels and Toolbars to the place you prefer (see the animation below).
3.1 Add Data to Map Canvas#
The primary way to add data to QGIS Map Canvas is by Drag-and-Drop items in the Browser panel.
Another way to add data is by loading layer from a file.
- 📌:
Use Favorites to quickly get to the data you used frequently:
In the Browser Panel, you can also add the folder you frequently used to Favorites. To avoid long path shown in the Favorites, you can also
Rename Favorite....Now, lets load Districts of Botswana, Road Network, and Health Facility to Map Canvas, as shown in below.
|
Add Data to Map Canvas |
|---|
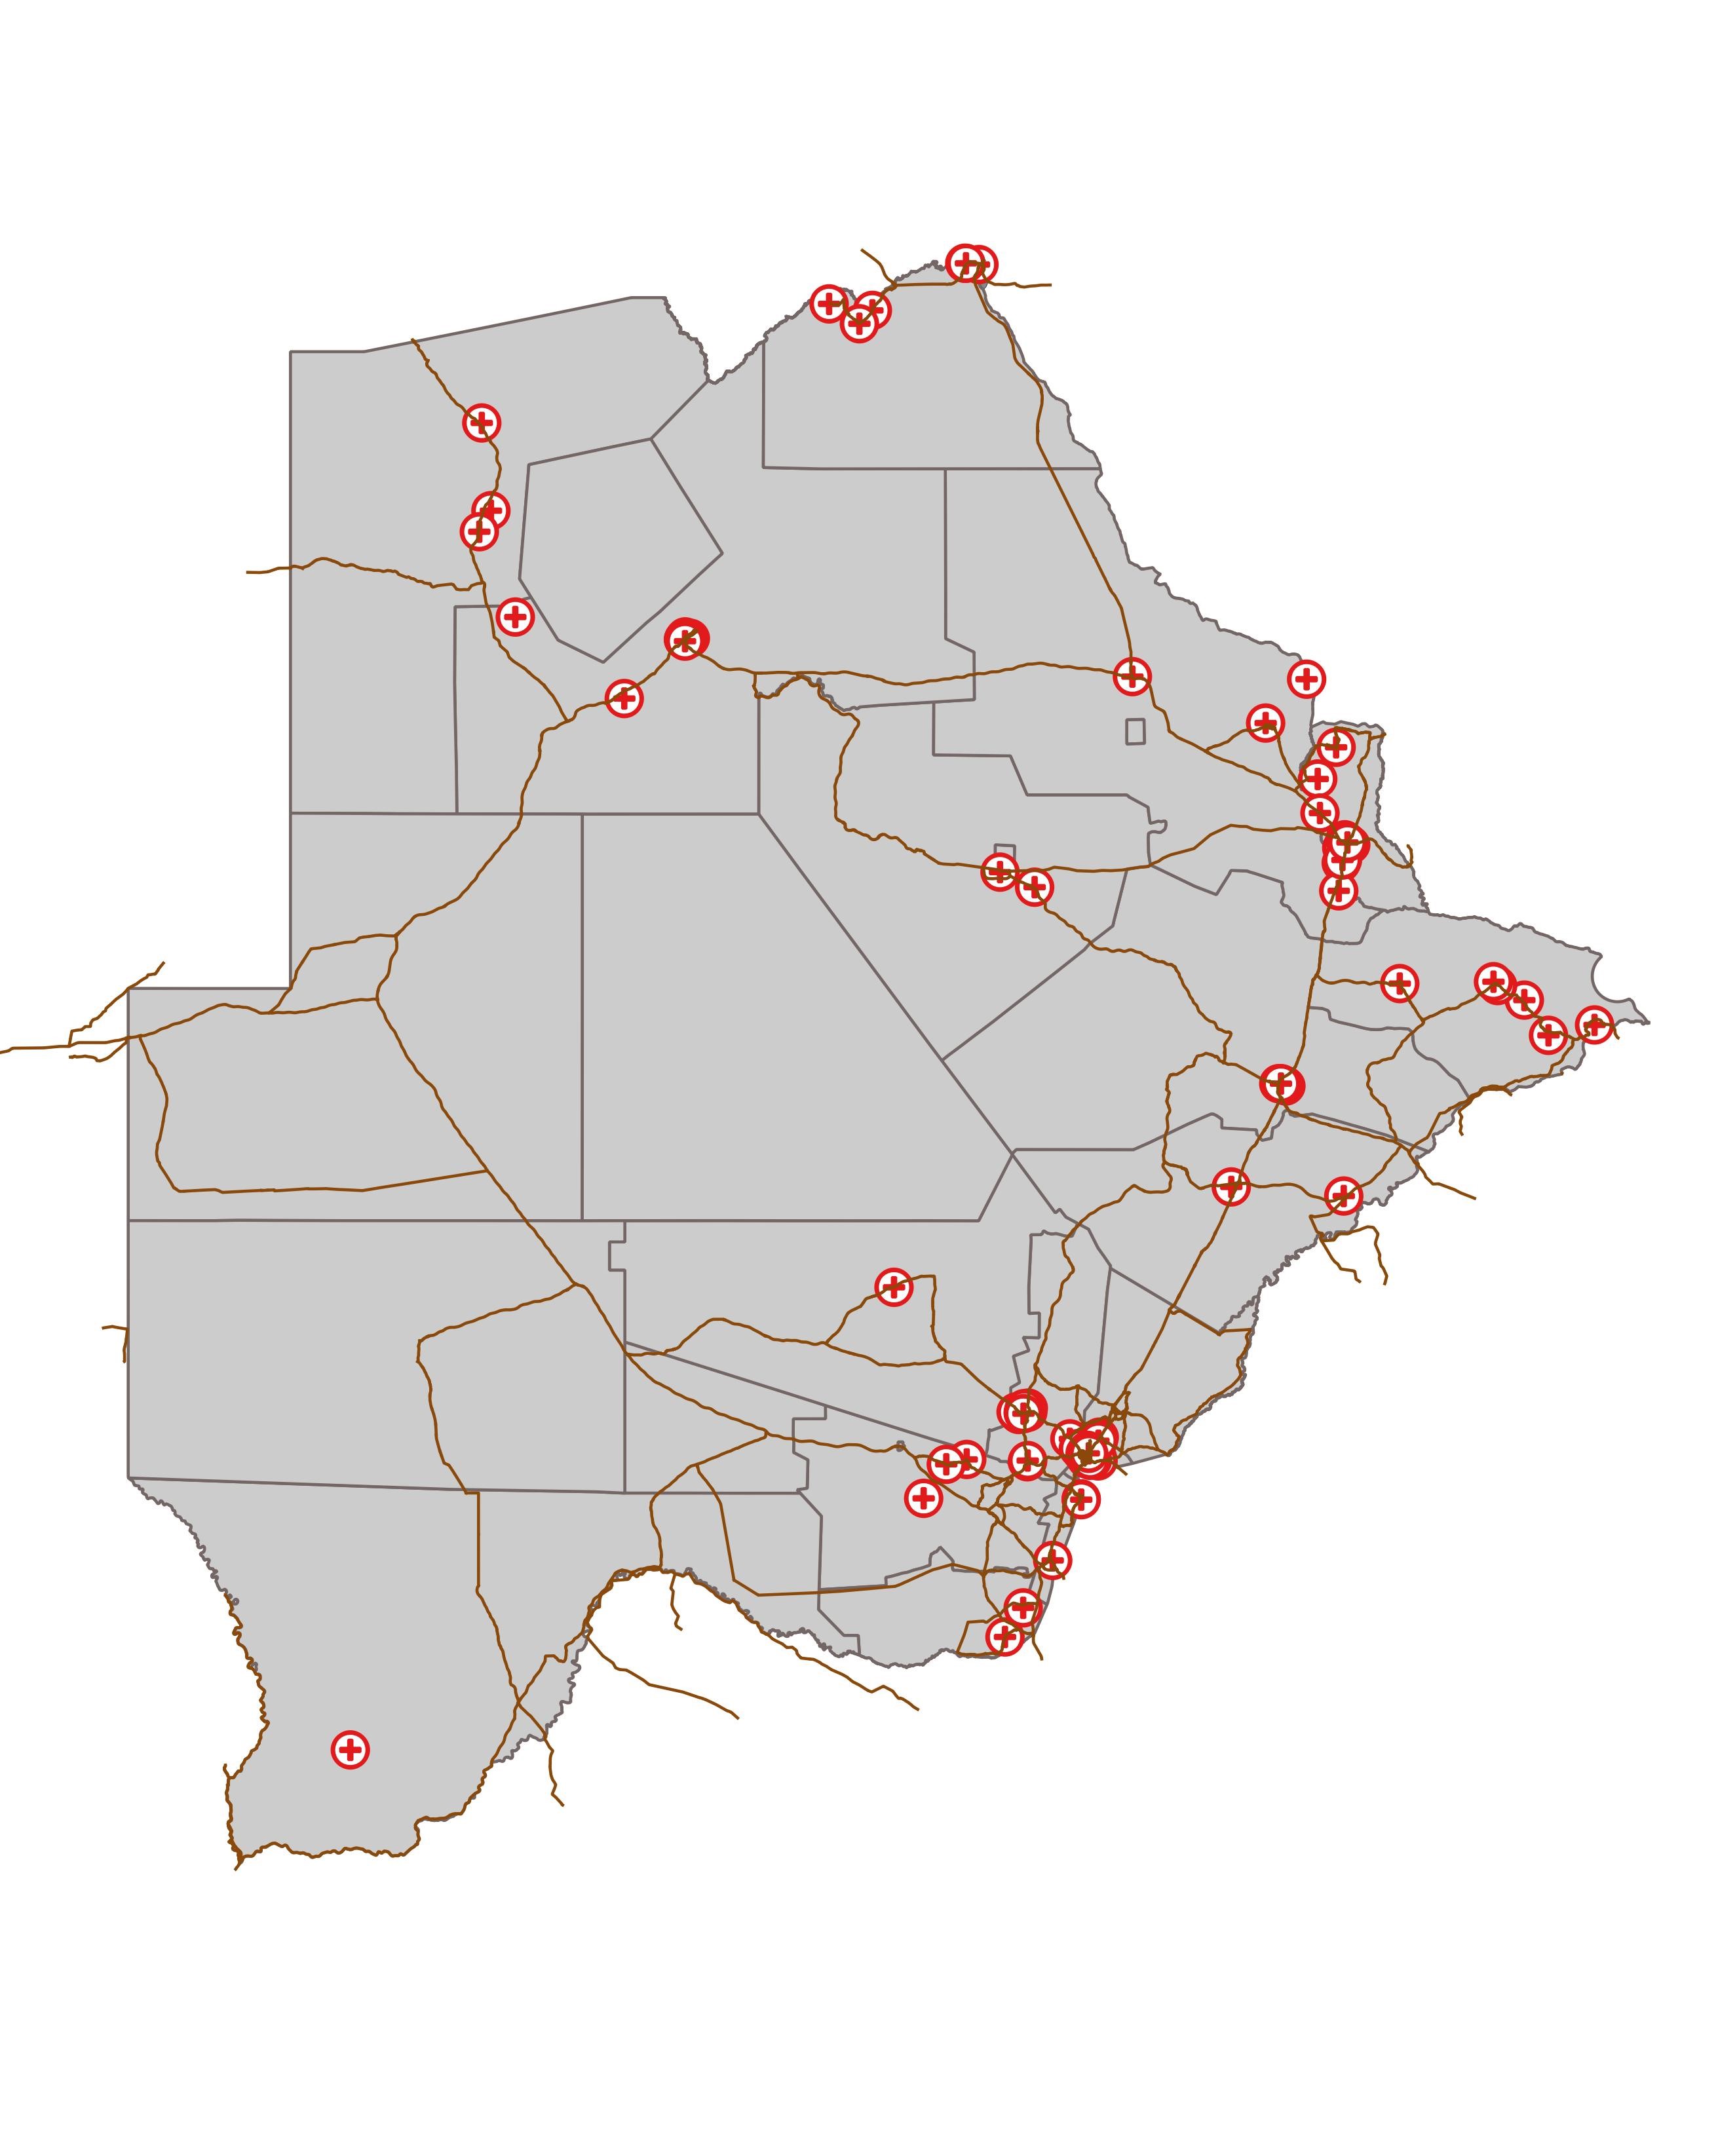
|
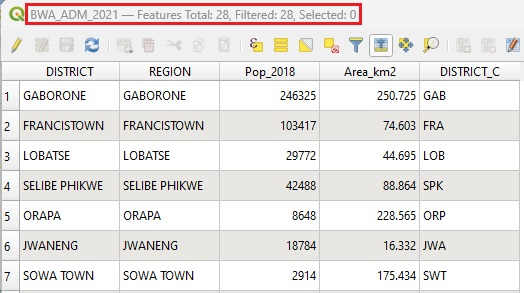
3.2 Check data in the Attribute Table#
The Attribute Table displays information on features of a selected layer.
Right click the layer of your interest, and click
Open Attribute Table.As circled in the image below, the title of the Attribute Table window includes: 1) the title of the layer, 2) the total number of the features in the layer, 3) the number of features are filtered, and 4) the number of features are selected.
|
Attribute Table |
|---|
|
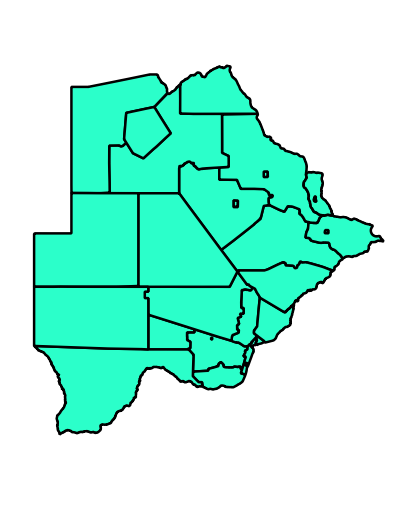
3.3 Change Symbology of a Layer#
The symbology of a layer is one of important functions in GIS. By presenting the data with a dynamic visual appearance on the map, you can better explore the data as you are working with it.
Symbolize the vector layers using Single Symbology in the layer properties.
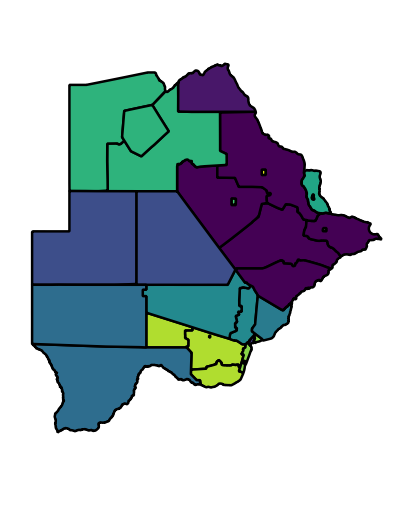
Choose the Categorized option to present the data, if you have data that is broken into categories (the image in the middle is using region column).
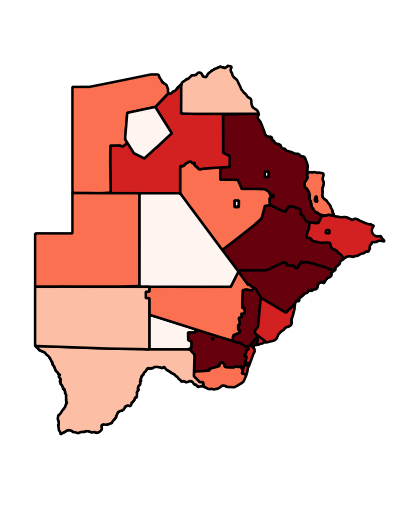
Choose the Graduated option to present the data, if you have numeric data you want to symbolize (the image on the right is using the population column).
|
Single Symbology |
Categorized Symbology |
Graduated Symbology |
|---|---|---|
|
|
|
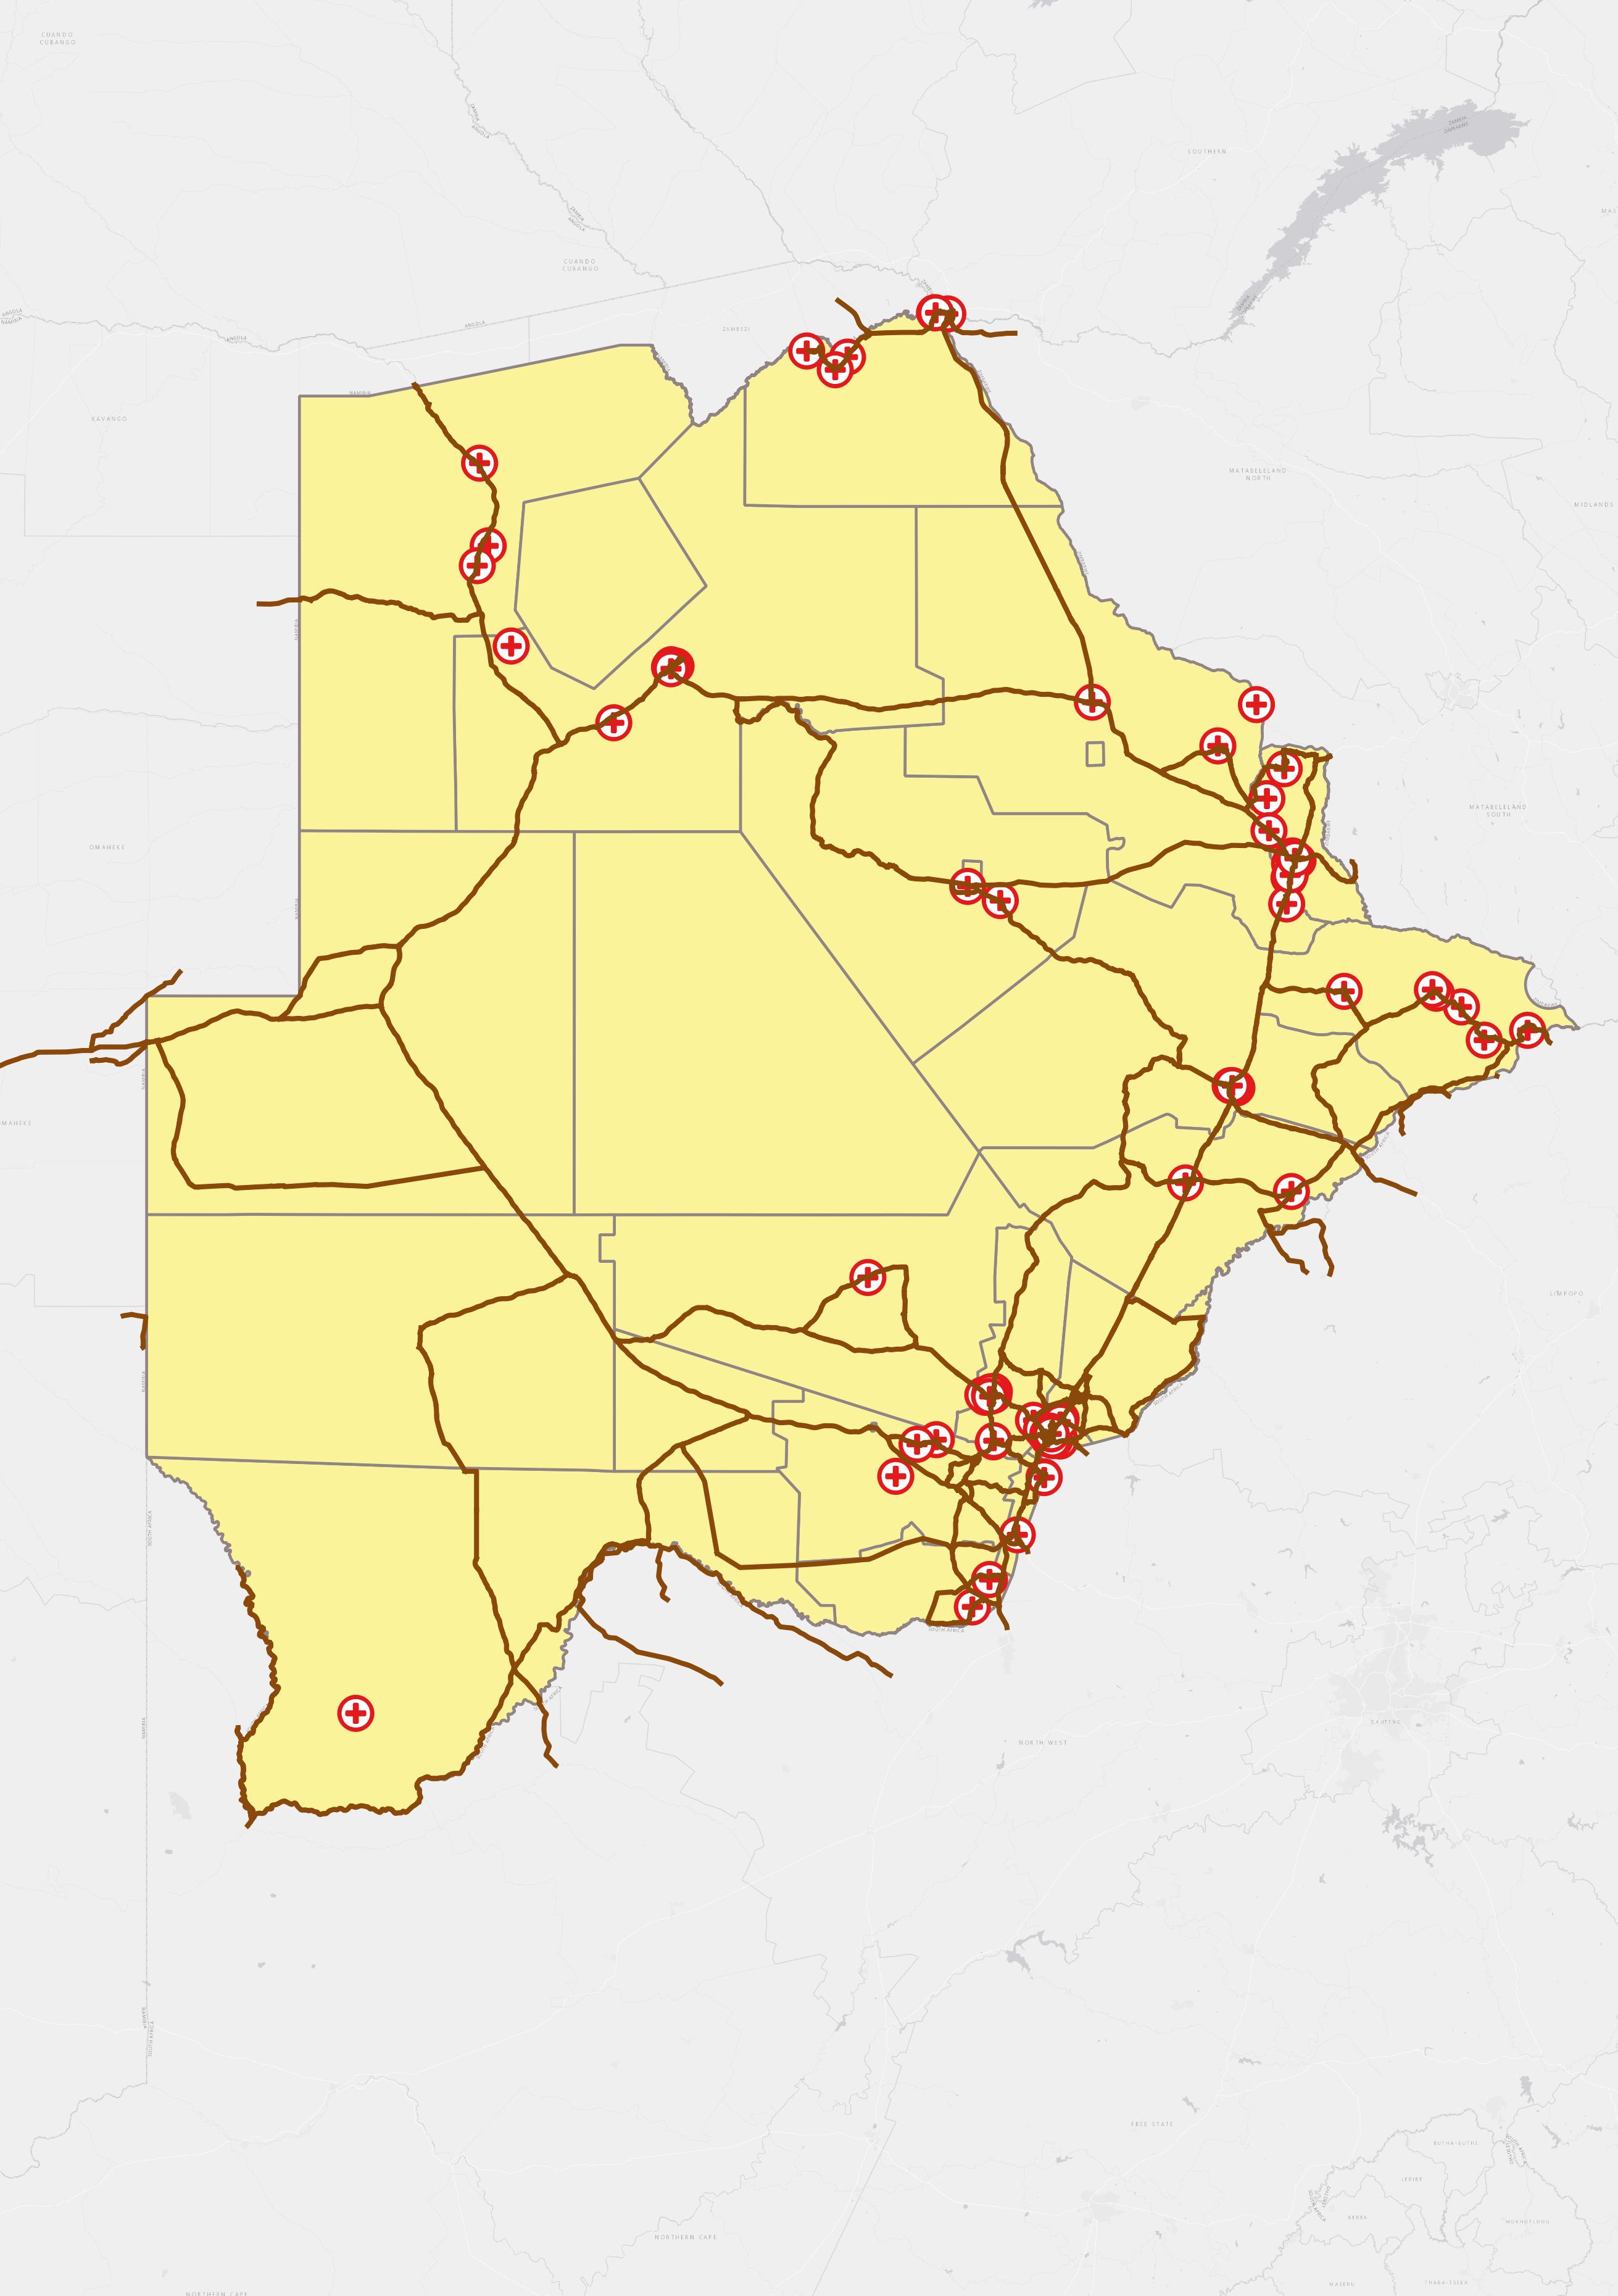
3.4 Add a Basemap to Map Canvas#
A Basemap is a layer with geographic information that serves as a background. A base map provides context for additional layers that are overlaid on top of the base map. In this module, we use QuickMapServices, a QGIS Plugin, to add basemap to Map Canvas.
Open the **Plugins** window at the main menu toolbar, and click
Manage and Install Plugins....Search and install a new Plugin called QuickMapServices.
After installation, open the QuickMapServices Settings window, click the More Services tab, and click Get contributed pack to get more basemaps. For details, please check out this tutorial.
Choose one basemap from the QuickMapServices and add it to Map Canvas.

|
Layer with a Basemap |
|---|
|
3.5 Create a Layout to Print Your Map#
After setting up the map, you are now ready to layout your map and print it (as a pdf file) to share with your colleagues.
Open the Layout Manager window, click the Create… button, and name your map and click OK to open the map window.
In the map window, click the Add Item button on the main menu bar, and click add map.
In order to have a decent map, you need: 1) a Title for your map, 2) a Legend to identify the elements in the map, 3) a Scale Bar to indicates the scale of the map, 4) a North Arrow to indicate the direction. You can add these items under the
Add Itembutton.After you finishing all the layout of your map, click the
Layoutbutton on the main menu bar, and click Export as PDF… to export your map. (If the basemap cannot be rendered in the PDF file, try a lower dpi (e.g., 150 dpi) in the Export Setting in the Layout Panel.See the example map in PDF file here.
4. Exercises and Post-training Survey#
Please complete the Exercise 1.
Please complete the Exercise 2.
Please take this post-training survey (required).
Please submit your exercises here.
5. Additional Resources#
What is GIS and why use QGIS (YouTube video by Statistics Canada)
Git & GitHub Tutorials for Beginners (YouTube playlist by The Net Ninja)
6. What’s Next?#
Module 2 - Introduction to LUCIS-OPEN Tools for QGIS.